The Net Zero Carbon Buildings Commitment (the Commitment) recognises and promotes advanced climate leadership action in decarbonising the built environment.
The Commitment currently has 160 signatories, from 127 businesses & organisations, 27 cities and 6 subnational governments, across 70+ different countries.
This analysis is based on the reporting data from the business signatories to the Commitment, it does not include cities or subnational government signatories.
Signatories track their ongoing decarbonisation progress and the impact of their actions. The following insights have been produced using the 2024 submission of emissions data. Year-on-year we have seen an increase in disclosures until 2023. The current lower total for disclosures in 2024 reflects the time lag in reporting periods for independently verified or assured portfolio data (see Methodology section for further details).
This data is correct as of May 2025.
The businesses participating in the Commitment have achieved a net reduction in carbon across their cumulative portfolios. This is a total net reduction of 850,324 tCO2e – a reduction equivalent to powering 107,000 UK homes for a year (one UK home emits ~7.9 tonnes CO2e/year from energy use).
Since joining, frontrunner Commitment signatories (who have seen an overall reduction) have reduced emissions by 1,026,318 tCO2e (excluding those whose total emissions have increased since joining the Commitment).
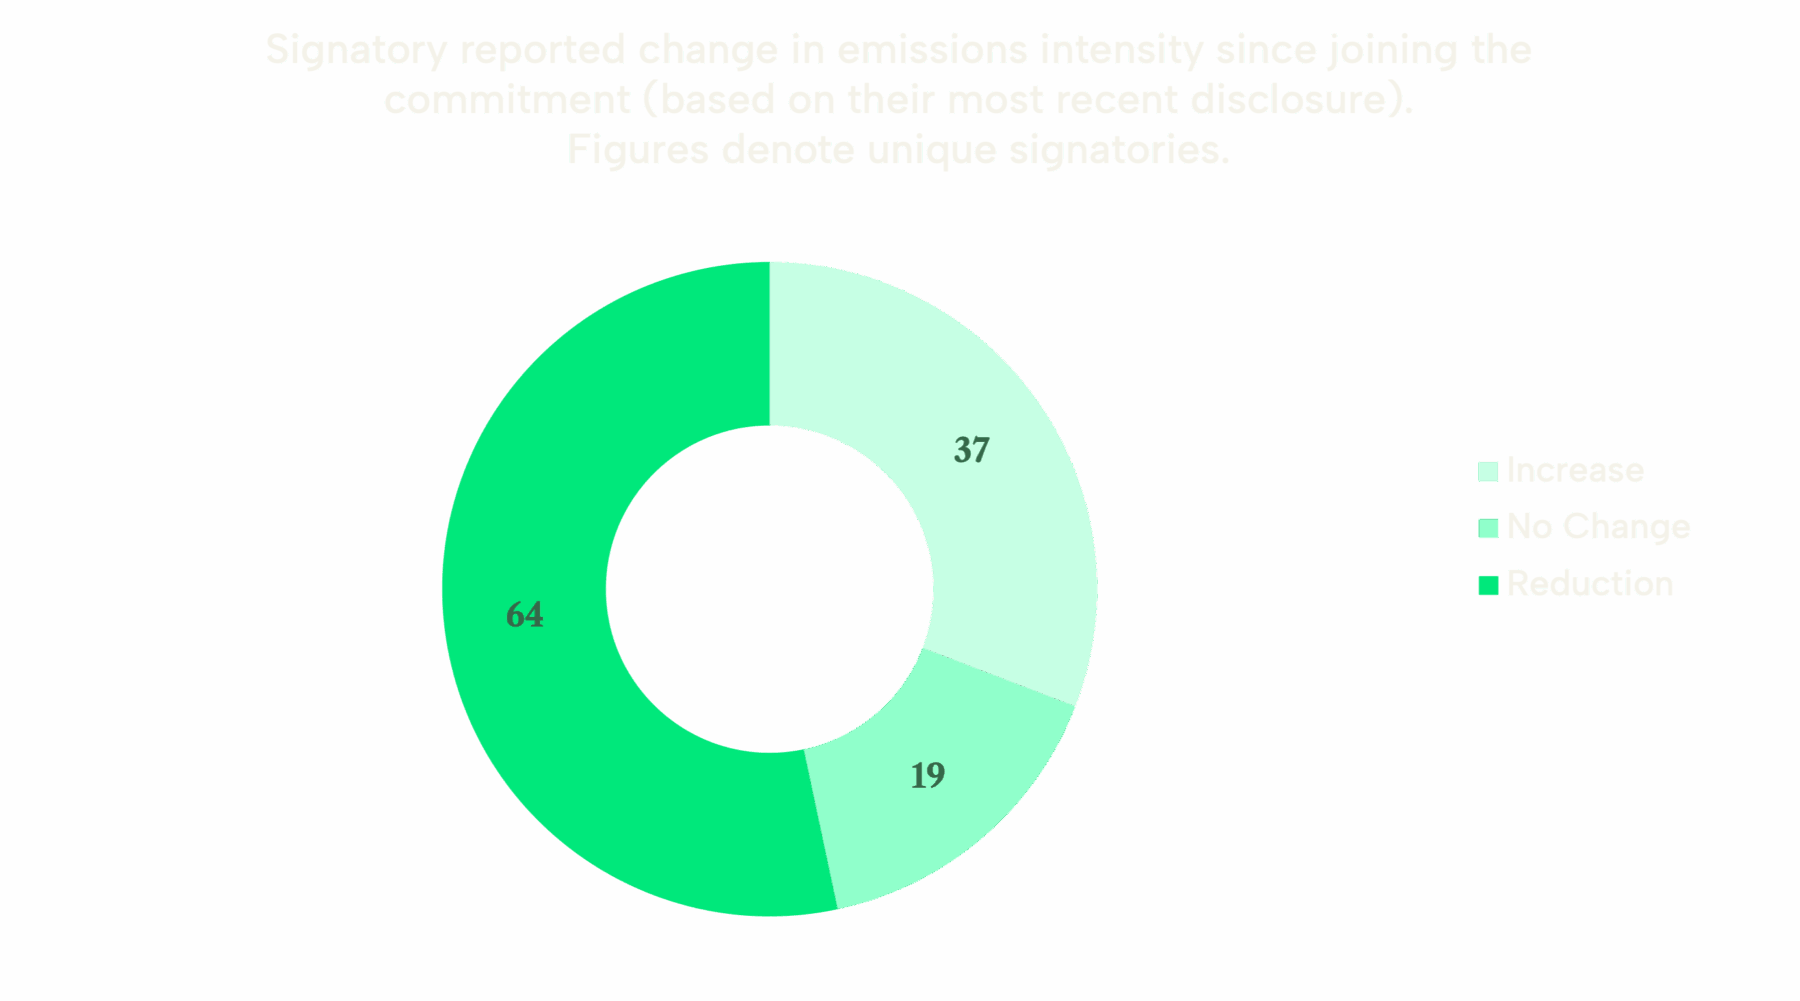
A majority of Commitment signatories (almost 60%) report a reduction in the energy use intensity of their portfolio. This means that not only are they procuring more renewable energy to reduce overall emissions, but they are also implementing proactive energy efficiency measures as well.
Almost 80% of signatories now have a decarbonisation roadmap in progress or in place. This is a critical step, as developing a decarbonisation roadmap allows a business to effectively plan how they will decarbonise their portfolio and implement actions accordingly.
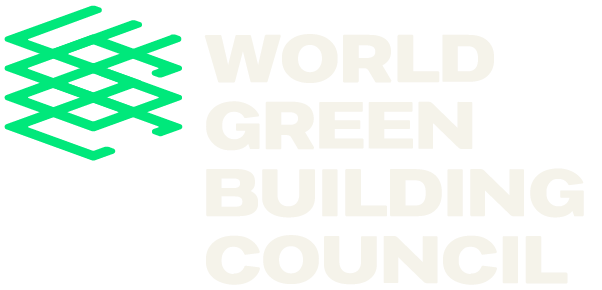
Nearly half of signatories reported an increase in their gross floor area (GFA) since joining the Commitment. Encouragingly, despite this increase in size, more than half (53%) signatories reported a reduction in their emission intensity, with a third of those reporting a reduction, seeing a reduction of more than 50%.
Source data: Unique signatories with multi-year disclosures. Signatories with only one years’ disclosure, or reported ‘0’, are included in “No Change”.
Emissions intensity is a good representation of decarbonisation progress as it reflects reducing emissions relative to another factor, in this case GFA. This can be beneficial because it accounts for increases or decreases in portfolio size, encourages efficiency and allows for clearer benchmarking and comparison.
Energy Use Intensity is calculated by dividing the total energy used by the GFA. It reflects the progress in reducing use of fossil fuels and increasing use or procurement of renewable energy.
Source data: Unique signatories who have made a disclosure for a given year.
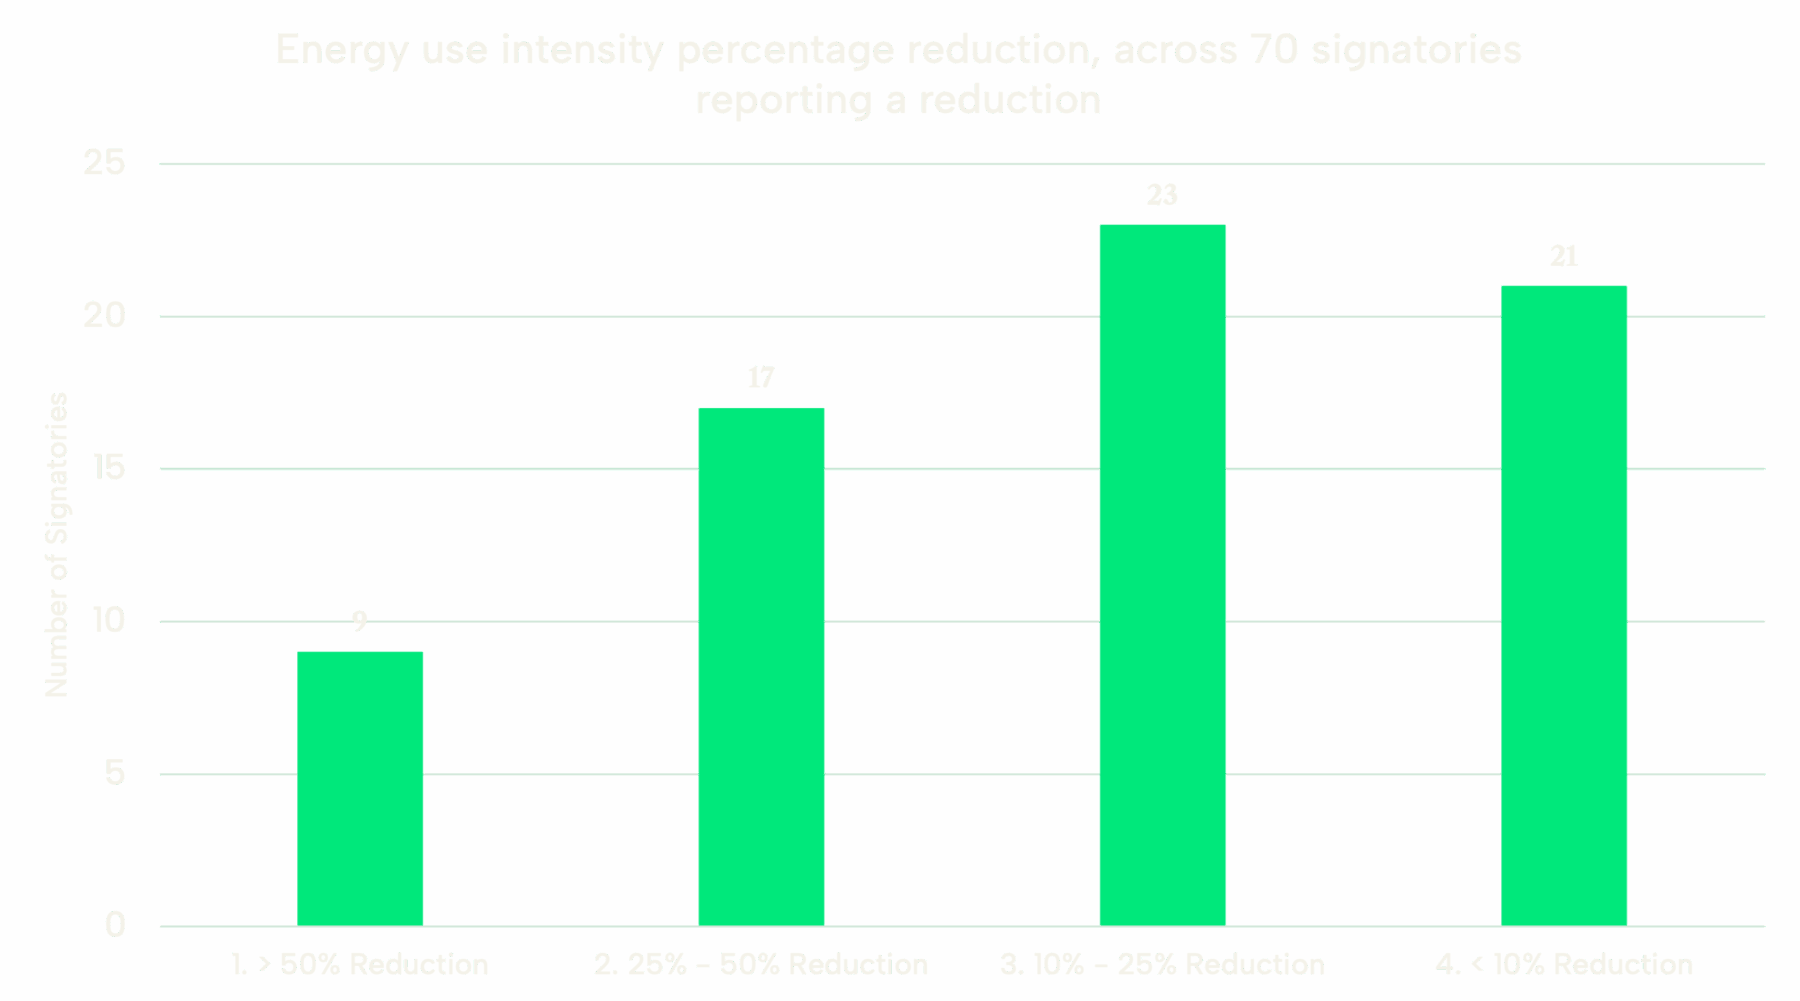
By switching from fossil fuel supplies to renewable energy, signatories are reducing their Scope 1 and 2 emissions. They are achieving this by installing on-site renewable generation, procuring off-site renewable energy, and electrifying buildings to remove fossil fuel connections altogether.
Over 50% of signatories disclosed use of off-site renewables in 2023. Procuring renewable energy is a key demand signal that contributes to further decarbonisation of the energy sector. By showing an increase in demand, suppliers will seek to install and generate more renewable energy through sources such as solar, wind and geothermal energy. Industry demand signals like this are crucial for accelerating action towards the Global Stocktake goal of tripling renewable energy production.
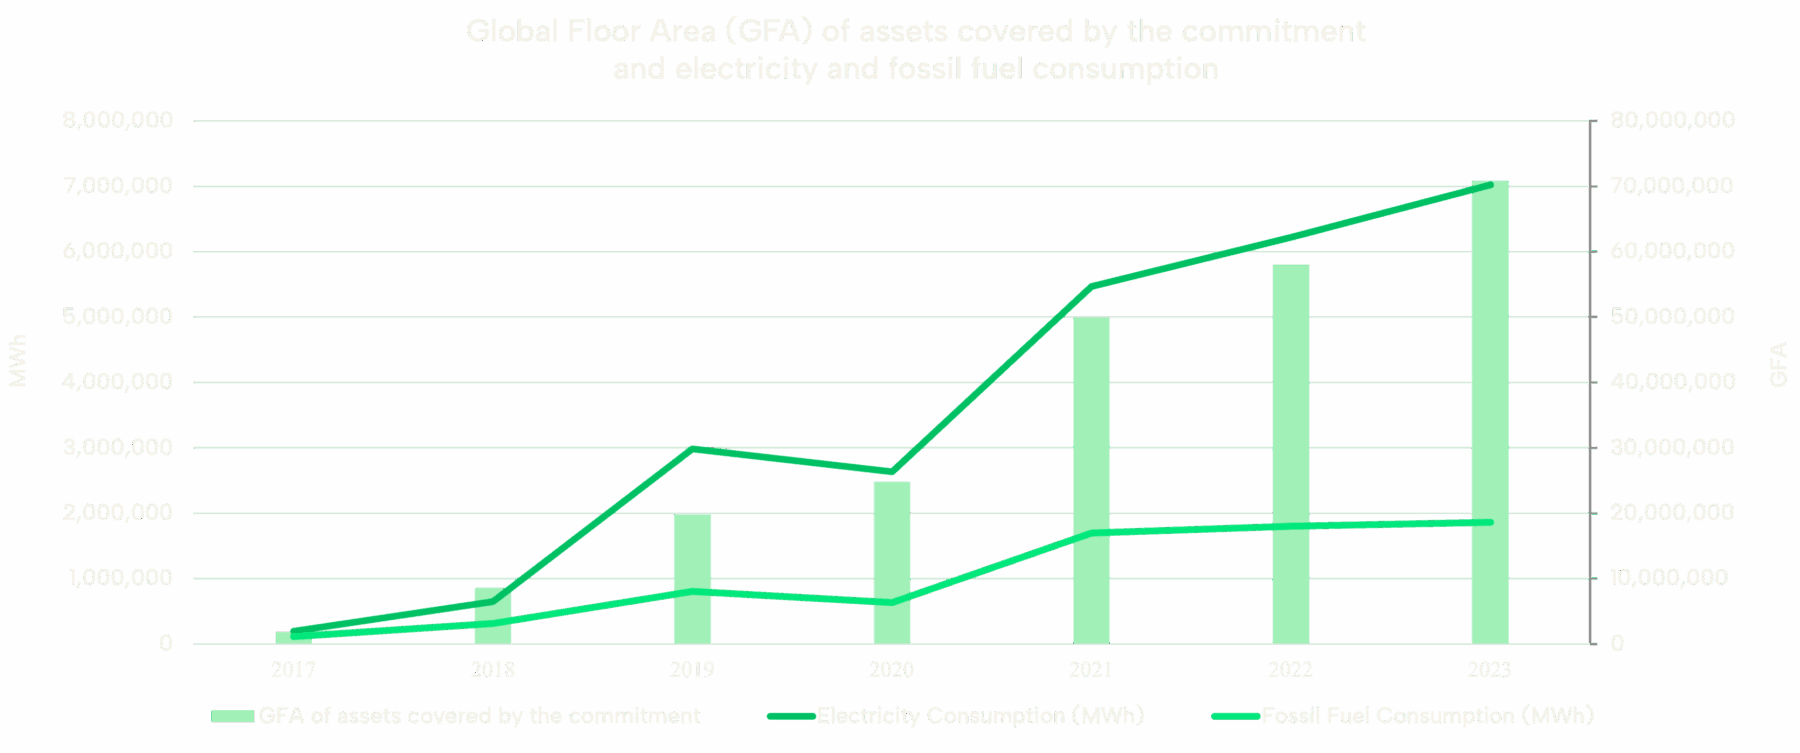
Source data: Unique signatories who have made a disclosure for a given year.
Signatories are transitioning away from the use of fossil fuels within their buildings.
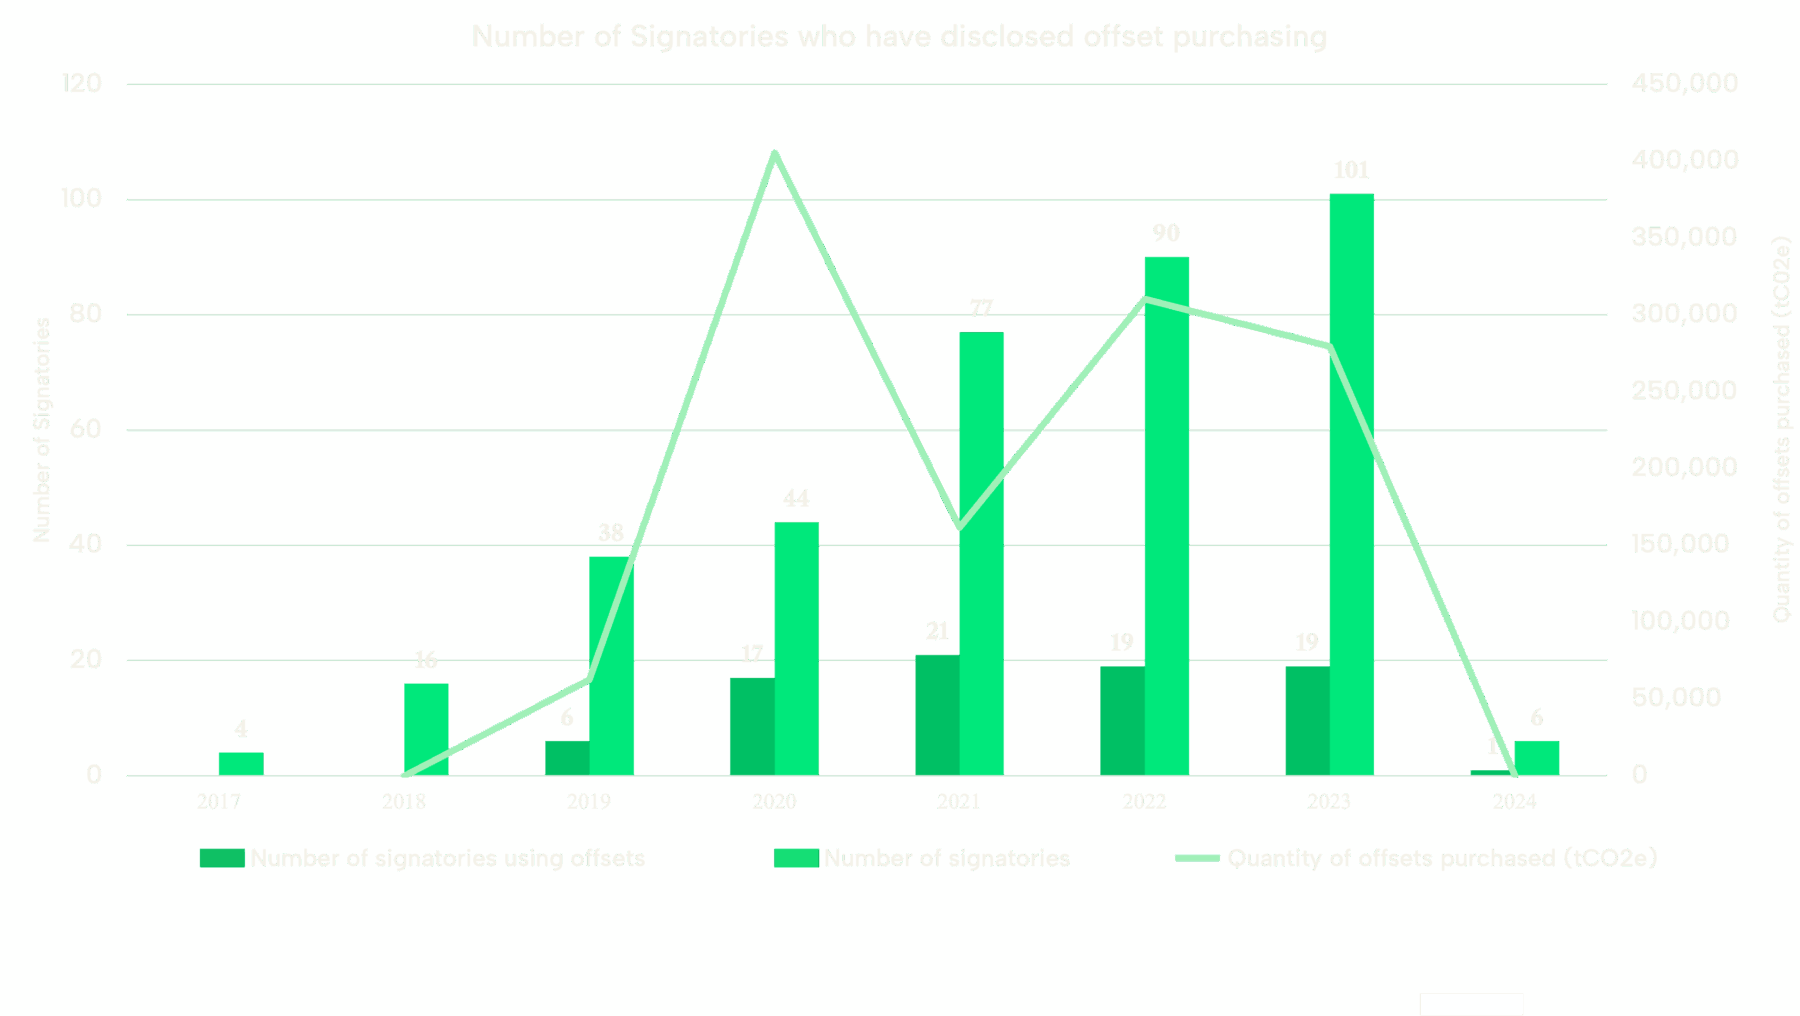
Source data: Unique signatories who have made a disclosure for a given year. Purchased offsets are allocated to the year of disclosure.
WorldGBC advocates for halving emissions of the building and construction sector by 2030 and the total decarbonisation of the sector by 2050. As we transition, we also recognise the value of good quality offsets* as a means to compensate for and neutralise the impacts of the sector in pursuit of overall net zero emissions. Offsets should only be utilised after all other mitigation efforts have been explored.
*WorldGBC advises alignment with best practice guidance on offsets, following the recommendations of your local Green Building Council and/or market leading initiatives, such as the Oxford Principles for Net Zero Aligned Carbon Offsetting (revision 2024) or Science-Based Targets (SBTi).
The Commitment requires signatories to maximise the reduction of upfront embodied carbon emissions for new developments and major renovations over which they have direct control. From 2023, reporting on embodied carbon data for projects that achieve practical completion within the reporting period became mandatory for signatories.
Since embodied carbon emission reporting only became mandatory in 2023, it is too early in the process to make significant comparisons and analysis of data. However, we can highlight individual cases of action where we are seeing clear steps to help achieve reductions moving forwards:
Signatories are also encouraged to advocate for and encourage action beyond the immediate scope of the Commitment, both in relation to their own business actions and their supply chain. This is important in encouraging others to set targets and take action considering the fragmented nature of the built environment’s supply and value chains.
Signatories have recorded over 690 individual advocacy actions across over 20 stakeholder types.
Here are examples of different advocacy actions undertaken by signatories:
The Commitment business signatories are clearly delivering on their aim to decarbonise. Cumulatively, they have achieved a total net reduction in carbon, with widespread reductions in Energy Use Intensity and increased adoption of renewable energy. This shows that signatories are implementing measures to actively decarbonise buildings rather than simply offloading underperforming assets or purchasing offsets.
These efforts are also contributing to wider sector transformation by sending key demand signals both to mainstream industry stakeholders and, crucially, to policymakers to showcase what is already being achieved.
The Commitment is recognised as a private demand lever in the Race to Zero Breakthrough Agenda Built Environment 2030 goals, with signatories recognised as frontrunners in the Race to Zero. It is also a supporting initiative of the Buildings Breakthrough.
Encouragingly, several signatories have achieved operational carbon neutrality through emissions reductions, renewable energy procurement, and offsetting to account for remaining residual emissions. We encourage them to minimise the use of offsets over time.
Since the Commitment was launched in 2018, the sector landscape has significantly shifted. One key aim of the Commitment was to address gaps in relation to accountability and disclosure within the built environment sector. The Commitment encouraged businesses to set 2030 targets and report their progress against them. Since then, there has been a significant increase in mandatory reporting standards and regulations, such as CSRD or TCFD, which has increased the resourcing and capacity needed within businesses. This is a positive change – it means that the gap identified in 2018 is closing and that mandatory reporting measures are becoming the norm.
The data analysis was carried out by a third party on behalf of WorldGBC using anonymised data. The most recent reporting period was 2024.
Year-on-year we have seen an increase in unique signatories with disclosures reaching over 100 in 2023. The lower total in 2024 reflects the lag in disclosures. During each annual reporting period, WorldGBC allows signatories to report the most recent 12 months of independently verified or assured portfolio data to allow signatories to align with their own internal or other external reporting requirements. The allocated ‘year’ attributed to the data insight is defined as the mid-point of a signatory’s disclosure ‘reporting year’. e.g. if a signatory has a reporting period from 1 October 2022 to 30 September 2023, we have attributed this disclosure to 2023 (mid-point is 1 April 2023). As a result of this normalisation, the largest and most complete dataset is for 2023.
Prior to 2023, disclosures were not specified as either market or location based. As is best practice, since 2023, WorldGBC has requested both market and location-based figures within signatory disclosures. This requirement was not part of disclosures pre-2023 and therefore may mean that most recent data is being compared with data calculated with a different method. For example, switching to a green tariff would appear to reduce emissions under the market-based tariff while actual energy consumption and grid impact remain unchanged.
Moving forwards, data analysis will be done against comparable data i.e. market vs market, location vs location.
When considering the data analysis and insights, the impact of Covid should additionally be considered as a significant event impacting or skewing the data for 2020/2021.